DIGITAL CORNER
By Bob Dean
Histograms
Histograms are those strange looking displays that we can see on our digital camera’s LCD display. These things are great tools for determining if the exposure was correct. It is one of the best parts of digital photography in that you no longer need to wait to receive images form the lab to see if your exposure was correct.
What is really displayed on a histogram? Essentially the histogram displays graphically the number of pixels that recorded various levels of brightness. The left most edge represents black and the right edge represents white. In between are 254 other brightness indicators (256 in all). The height of the display for each brightness indicates the number of pixels that recorded that level of brightness.
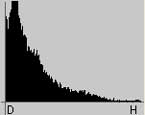
This histogram shows an image that has a lot of very dark parts, probably an underexposed image.
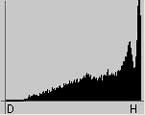
This histogram is just the opposite, showing a large number of pixels recording very bright levels -overexposed.
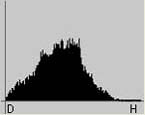
A “properly” exposed image shows most of the pixels are not full black or full white.
This little bit of knowledge and some practice will allow you to shoot an image, check the LCD for composure, then check the histogram for proper exposure. With some practice, you’ll be able to quickly check your images and have many more properly exposed ones.
As you experiment with histograms, you’ll discover that as with just about every aspect of photography there are tradeoffs and times when the “rules” don’t necessarily apply. Take notes and see how your histogram checks can improve your exposure. The adage “fix it in Photoshop™” has limitations. Properly exposed images require much less computer work and will allow more time in the field.